|
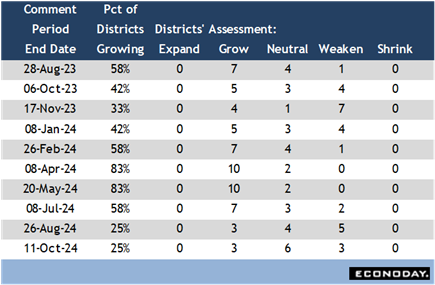
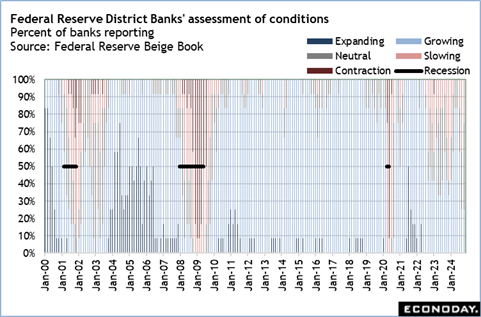
The data release schedule was light in the October 25 week and market impact from the numbers was limited. Perhaps the most important information to arrive was the Fed’s Beige Book on Wednesday at 14:00 ET. The anecdotal evidence of conditions across the 12 Fed district banks for the period between late August and early October suggests that the overall US economy was neither growing nor shrinking. Half of the districts reported conditions roughly unchanged from the prior report, with a quarter showing slight expansion and a quarter showing slight contractions. With no real change in economic momentum, the FOMC is probably on track for a 25-basis point rate cut when it meets on Wednesday and Thursday, November 6-7.
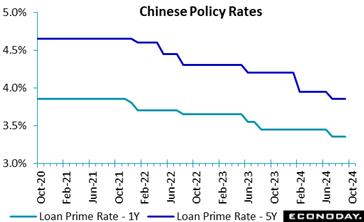 The People's Bank of China lowered both the one-year and five-year loan prime rates by 25 basis points to 3.10 percent and 3.60 percent respectively at its monthly review today. Both rates were also reduced by 10 basis points in July. The People's Bank of China lowered both the one-year and five-year loan prime rates by 25 basis points to 3.10 percent and 3.60 percent respectively at its monthly review today. Both rates were also reduced by 10 basis points in July.
Today's reductions in the loan prime rates follow a series of policy measures announced by Chinese officials in recent weeks in response to ongoing weakness in the property sector and sluggish growth in consumer spending and manufacturing output. Officials had already lowered the seven-day reverse repo rate, cut banks' reserve requirements, and announced government spending planned for next year would be brought forward.
In their statement accompanying the publication of economic data last week, officials assessed that the economy is "generally stable with steady progress" but noted "the complicated and severe external environment" and "new problems of domestic economic development". Officials, however, provided little guidance about whether additional changes to policy settings will be considered in the near-term.
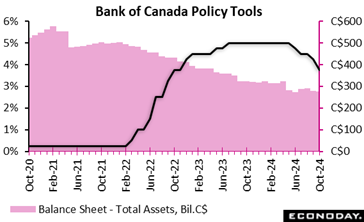 The Bank of Canada, as expected in the Econoday consensus forecast, aggressively cut its target interest rate by 50 basis points to 3.75 percent, as the central bank shifts its attention from slowing the rate of inflation to jumpstarting economic activity. The Bank of Canada, as expected in the Econoday consensus forecast, aggressively cut its target interest rate by 50 basis points to 3.75 percent, as the central bank shifts its attention from slowing the rate of inflation to jumpstarting economic activity.
"With inflation now back around the 2 percent target, Governing Council decided to reduce the policy rate by 50 basis points to support economic growth and keep inflation close to the middle of the 1 percent to 3 percent range," the BoC statement said. "If the economy evolves broadly in line with our latest forecast, we expect to reduce the policy rate further."
The central bank expects economic growth to slow from 2 percent in the first half of 2024 to 1.75 percent in the second half, pointing to a decline in consumption and a soft labor market. The BoC forecasts GDP growth of 1.2 percent in 2024, 2.1 percent in 2025, and 2.3 percent in 2026.
It expects inflation to remain close to its target over the projection horizon, with both upward and downward pressures on consumer prices "roughly balancing out."
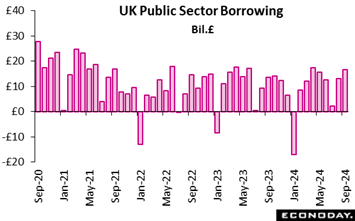 Public sector finances continued to deteriorate by more than expected in September. Overall net borrowing (PSNB) was £16.61 billion, well above the £10.3 billion consensus and also up on both August's downwardly revised £13.02 billion and the £14.48 billion recorded a year ago. This represents the third highest September borrowing on record. Note that since the reclassification of National Westminster bank as a private institution, borrowing excluding public sector banks (PSNB-X) now matches the total PSNB. Public sector finances continued to deteriorate by more than expected in September. Overall net borrowing (PSNB) was £16.61 billion, well above the £10.3 billion consensus and also up on both August's downwardly revised £13.02 billion and the £14.48 billion recorded a year ago. This represents the third highest September borrowing on record. Note that since the reclassification of National Westminster bank as a private institution, borrowing excluding public sector banks (PSNB-X) now matches the total PSNB.
Total public sector spending increased £5.9 billion on the year as rises in debt interest and higher spending on public services were partially offset by reduced spending on benefits. Receipts were up only £3.8 billion although this was the steepest yearly gain in the last six months. Net debt was 98.5 percent of GDP, 0.3 percentage points below the August reading but still around the levels last seen in the early 1960s.
Borrowing in September was £1.5 billion more than forecast by the Office for Budget Responsibility and so again underscores the very real problems facing new Chancellor of the Exchequer Rachel Reeves as she compiles here Budget for 30 October. A probable sizeable increase in net taxes seems unavoidable without some redefining of fiscal targets. Today's update trims the UK RPI to minus 10 and the RPI-P to 17. Overall economic activity is still slightly underperforming but only due to the surprising weakness of prices.
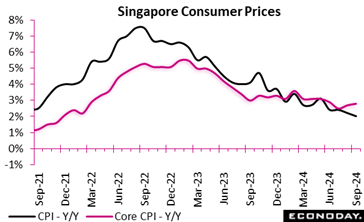 Singapore's headline consumer price index rose 2.0 percent on the year in September, moderating from the 2.2 percent increase recorded in August. The index rose 0.3 percent on the month after increasing 0.7 percent previously. The Monetary Authority of Singapore's preferred measure of core inflation, which excludes the cost of accommodation and private road transport, rose from 2.7 percent in August to 2.8 percent in September. This index rose 0.1 percent on the month after advacning 0.3 percent previously. Singapore's headline consumer price index rose 2.0 percent on the year in September, moderating from the 2.2 percent increase recorded in August. The index rose 0.3 percent on the month after increasing 0.7 percent previously. The Monetary Authority of Singapore's preferred measure of core inflation, which excludes the cost of accommodation and private road transport, rose from 2.7 percent in August to 2.8 percent in September. This index rose 0.1 percent on the month after advacning 0.3 percent previously.
The increase in core inflation in August was largely driven by a bigger increase in prices of retail and other goods, up 0.8 percent on the year after a previous increase of 0.4 percent. Private transport costs fell 2.4 percent on the year after a previous decline of 1.0 percent, with other categories recording steady price increases.
Officials at the MAS retained their target for appreciation of Singapore's exchange rate at their last quarterly meeting earlier in the month. They advised then that expect core inflation will remain subdued for the rest of the year and to average around 2 percent in 2025. Based on this assessment, officials concluded that "monetary policy settings are for now still consistent with medium-term price stability".
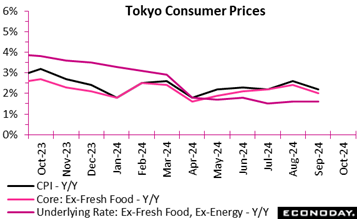 Consumer inflation in Tokyo, the leading indicator of the national average, decelerated further in two key reading in October as renewed utility subsidies have capped electricity and natural gas prices. The core reading (only fresh food is excluded) posted a 1.8% increase after slowing to 2.0% in September from 2.4% in August, as expected. The year-on-year rise in the total CPI also slowed further to 1.8% from 2.1% (revised from +2.2%), coming in just under the median forecast of 1.9%. The annual rate for the core-core CPI (excluding fresh food and energy) unexpectedly rose to 1.8% from 1.6% against consensus of being steady at 1.6%. Consumer inflation in Tokyo, the leading indicator of the national average, decelerated further in two key reading in October as renewed utility subsidies have capped electricity and natural gas prices. The core reading (only fresh food is excluded) posted a 1.8% increase after slowing to 2.0% in September from 2.4% in August, as expected. The year-on-year rise in the total CPI also slowed further to 1.8% from 2.1% (revised from +2.2%), coming in just under the median forecast of 1.9%. The annual rate for the core-core CPI (excluding fresh food and energy) unexpectedly rose to 1.8% from 1.6% against consensus of being steady at 1.6%.
Energy costs added only 0.12 percentage point to the total CPI, down from +0.44 point in September while processed food prices lifted the index by 0.87 point, up from +0.64 point the previous. The slower CPI rise in October was also due to a drop in internet user fees to zero on year from +8.0% in September, pushing down the index by 0.05 point.
The Bank of Japan is focused on medium-term inflation outlook and its process of raising interest rates gradually toward more normal levels from around zero percent is not dictated by CPI data. The bank is widely expected to stand pat next week but is seen acting in December with a 25 basis point rise after conducting its first rate hike in 17 years in March and following up in July.
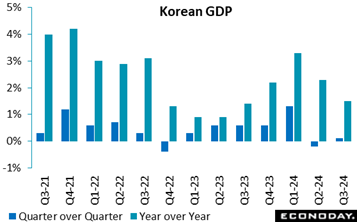 Advance estimates for South Korean GDP show the economy remained weak in the three months to September. GDP rose just 0.1 percent on the quarter, up modestly from a contraction of 0.2 percent in the three months to June, with year-over-year growth slowing from 2.3 percent to 1.5 percent. This is the slowest year-over-year growth in four quarters. PMI surveys also showed subdued growth in South Korea's manufacturing sector in July and August, followed by contraction in September, with monthly industrial production data showing modest growth. Advance estimates for South Korean GDP show the economy remained weak in the three months to September. GDP rose just 0.1 percent on the quarter, up modestly from a contraction of 0.2 percent in the three months to June, with year-over-year growth slowing from 2.3 percent to 1.5 percent. This is the slowest year-over-year growth in four quarters. PMI surveys also showed subdued growth in South Korea's manufacturing sector in July and August, followed by contraction in September, with monthly industrial production data showing modest growth.
This subdued headline GDP growth in the three months to September reflects weaker export growth, down 0. 4 percent on the quarter after a previous increase of 1.2 percent. Domestic demand, in contrast, improved. Private consumption rose 0.5 percent on the quarter after contracting by 0.2 percent previously, while investment spending rebounded with an increase of 0.7 percent after falling 1.4 percent previously. Government consumption rose at a steady pace.
At their most recent policy meeting earlier this month, officials at the Bank of Korea reduced policy rates by 25 basis points from 3.50 percent to 3.25 percent. This decision reflected officials' assessment that "that inflation will stabilize at the target level and that the moderate growth trend will continue" Officials also expressed confidence about the growth outlook, forecasting GDP to expand by 2.4 percent this year and by 2.1 percent next year.
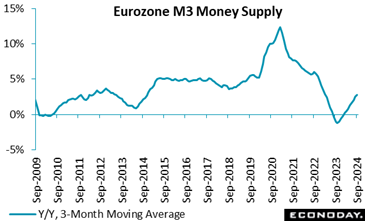 Broad money growth accelerated again in September. At 3.2 percent, the annual rate was up from August's unrevised 2.9 percent and the strongest since December 2022. The pick-up boosted the headline 3-monthly average rate to 2.8 percent, up from 2,5 percent previously and 0.1 percentage point above the market consensus. Broad money growth accelerated again in September. At 3.2 percent, the annual rate was up from August's unrevised 2.9 percent and the strongest since December 2022. The pick-up boosted the headline 3-monthly average rate to 2.8 percent, up from 2,5 percent previously and 0.1 percentage point above the market consensus.
Amongst the main counterparts, lending to the private sector posted an unchanged 1.3 percent yearly rise. Adjusted for transfers and notional cash pooling, the rate was a tick firmer at 1.6 percent. Within the latter, borrowing by households edged up 0.1 percentage point to 0.7 percent while the rate for non-financial corporations rose 0.3 percentage points to 1.1 percent.
The September data provide further evidence of the waning effects of earlier monetary tightening but remain soft enough to indicate still sluggish economic growth.
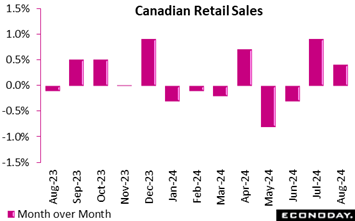 Canada retail sales increased 0.4% in August, following a 0.9 percent increase in July, and compared to expectations of a 0.5 percent rise in the Econoday consensus forecast. Statscan said sales were up in just four of nine subsectors, led by increases in sales by automotive and parts dealers. Canada retail sales increased 0.4% in August, following a 0.9 percent increase in July, and compared to expectations of a 0.5 percent rise in the Econoday consensus forecast. Statscan said sales were up in just four of nine subsectors, led by increases in sales by automotive and parts dealers.
Retail sales are up 1.4 percent from August 2023, following a 0.9 percent jump on an annual basis in July.
The August retail sales data underscores the Bank of Canada's concerns about flagging economic activity, which prompted its 50 basis point rate cut this week. The BoC does expects lower borrowing costs to eventually arrest the decline in consumer spending, although overall consumption rise isn't expected to pick up until the second half of 2025.
On a monthly basis, August's largest increase in retail sales in August was at motor vehicle and parts dealers (+3.5 percent). Higher sales at new car dealers (+4.3 percent) led the increase, followed by used car dealers (+4.3 percent). Sales at gasoline stations and fuel vendors were down 2.7 percent in August.
Core retail sales, excluding gasoline stations, fuel vendors and auto dealers, fell in August after two consecutive months of increases. They are down 0.4 percent after a 0.6 percent increase in July. Core sales rose 0.3 percent compared to August 2023, following a 0.5 percent year-over-year increase in July.
Core retail sales were dragged down by a decline in sales at food and beverage retailers (-1.5 percent). All four categories within that index fell, with supermarkets and grocery stores (-1.9 percent) leading the way. Furniture, home furnishings, electronics and appliance retailers (-1.4 percent) also experienced a decline in sales for August.
E-commerce sales fell 2.5% percent in August, after a 3.4 percent rise in July, making up 5.9 percent of total retail trade – compared with 6.1 percent in July.
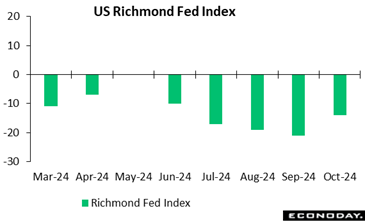 The contraction in manufacturing business activity in the Federal Reserve Bank of Richmond's district is moderating a bit. The Richmond Fed's composite manufacturing index edged up to minus 14 in October versus minus 21 in September and minus 19 in August. The Econoday consensus looked for a slight improvement to minus 17 in September. The contraction in manufacturing business activity in the Federal Reserve Bank of Richmond's district is moderating a bit. The Richmond Fed's composite manufacturing index edged up to minus 14 in October versus minus 21 in September and minus 19 in August. The Econoday consensus looked for a slight improvement to minus 17 in September.
New orders, the forward-looking indicator, came in at minus 17 in October versus minus 23 in September and minus 26 in August. Shipments improved to minus 8 from minus 18 and minus 15 in August.
Employment registered minus 17 versus minus 22 in September and minus 15 in August. Wages continue to rise: at 16 in October versus 15 in September and14 in August.
The Richmond Fed no longer reports seasonally adjusted prices paid or prices received figures. Not seasonally adjusted prices paid came in 2.70 in October versus 3.36 in September and 2.45 in August. NSA prices received registered 1.71 in October versus 1.57 in September and 1.87 in August.
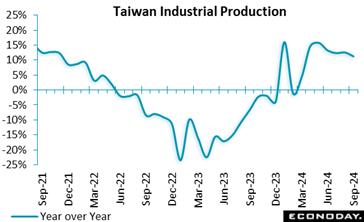 Taiwan's industrial production index rose 11.22 percent on the year in September, easing from an increase of 12.54 percent in August. Output in the manufacturing sector rose 12.11 percent on the year after a previous increase of 14.07 percent, with today's data also showing a year-over-year increase in output in the mining sector but a contraction in the electricity and gas sector. PMI survey data showed that the manufacturing sector expanded for the sixth consecutive month in September but at a slower pace. Taiwan's industrial production index rose 11.22 percent on the year in September, easing from an increase of 12.54 percent in August. Output in the manufacturing sector rose 12.11 percent on the year after a previous increase of 14.07 percent, with today's data also showing a year-over-year increase in output in the mining sector but a contraction in the electricity and gas sector. PMI survey data showed that the manufacturing sector expanded for the sixth consecutive month in September but at a slower pace.
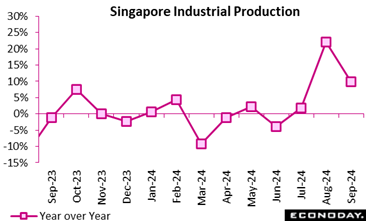 Singapore industrial production stagnated in September, with output flat on the month after increasing 6.9 percent in August. Previously published trade data also showed more moderate growth in exports in September, whereas PMI survey data showed ongoing strength in the aggregate economy. Singapore industrial production stagnated in September, with output flat on the month after increasing 6.9 percent in August. Previously published trade data also showed more moderate growth in exports in September, whereas PMI survey data showed ongoing strength in the aggregate economy.
In year-over-year terms, industrial production rose 9.8 percent in September after increasing 22.0 percent in August. This moderation in year-over-year growth was largely driven by the electronics industry, which accounts for nearly half of the sector, with output there increasing just 1.9 percent on the year after increasing 50.0 percent previously. The large increase in August was partly driven by base effects from weakness in semiconductor production twelve months earlier. In the biomedical industry, where conditions are often volatile, output surged higher with an increase of 62.0 percent after a previous decline of 16.1 percent. Output growth was mixed in other parts of the sector. Excluding the biomedical industry, output advanced 4.5 percent on the year in September after increasing 28.5 percent in August.
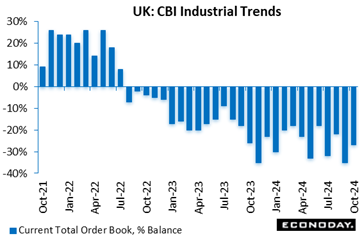 The UK's CBI industrial trends orders for October showed slight improvements, with a reading of -27, up from -35 in September. While still negative, indicating expectations for lower order volumes, this marks a gradual recovery from the 10-month low in September. The UK's CBI industrial trends orders for October showed slight improvements, with a reading of -27, up from -35 in September. While still negative, indicating expectations for lower order volumes, this marks a gradual recovery from the 10-month low in September.
This trend suggests that manufacturers still foresee challenges ahead, but the pace of decline in orders has slowed. The CBI's survey, which includes insights from 322 UK manufacturers, highlights ongoing caution in the sector, with businesses likely responding to subdued demand and broader economic uncertainties. Despite this, the reading could lend some short-term support to the British pound, as it signals a more optimistic outlook compared to previous forecasts.
However, the negative level still indicates that manufacturers expect further contraction in order volumes, underscoring the broader struggles of the UK's manufacturing sector. This gradual recovery may be linked to hopes of stabilizing business conditions, but overall, the sector remains vulnerable to both domestic and global economic pressures.
 New orders for durable goods in September are down 0.8 percent from August, and August is revised down to a decrease also of 0.8 percent from July. The September change is below the consensus of down 0.5 percent in the Econoday survey of forecasters. Much of the softness in the headline is due to the components for aircraft and parts. New orders for durable goods in September are down 0.8 percent from August, and August is revised down to a decrease also of 0.8 percent from July. The September change is below the consensus of down 0.5 percent in the Econoday survey of forecasters. Much of the softness in the headline is due to the components for aircraft and parts.
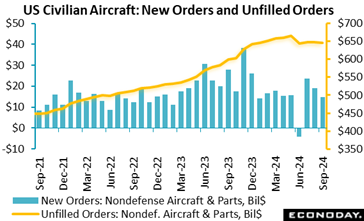 Orders for transportation are down 3.1 percent in September. Excluding transportation orders for durable goods are up 0.4 percent for the month. The transportation component is pulled down by a drops of 22.7 percent and 23.7 percent in nondefense and defense aircraft, respectively. Boeing orders are up in September to 65 units after 22 in August. However, these orders do not appear to have been booked quite yet, perhaps affected by the ongoing strike at the aircraft manufacturer. On the other hand, orders for motor vehicles and pars are up 1.1 percent and likely to rise in coming months as consumers and businesses replace vehicles lost to hurricane damage. Orders for transportation are down 3.1 percent in September. Excluding transportation orders for durable goods are up 0.4 percent for the month. The transportation component is pulled down by a drops of 22.7 percent and 23.7 percent in nondefense and defense aircraft, respectively. Boeing orders are up in September to 65 units after 22 in August. However, these orders do not appear to have been booked quite yet, perhaps affected by the ongoing strike at the aircraft manufacturer. On the other hand, orders for motor vehicles and pars are up 1.1 percent and likely to rise in coming months as consumers and businesses replace vehicles lost to hurricane damage.
Orders are mixed in other components, but mostly to the upside. Primary metals orders are up 0.5 percent in September and fabricated metal products up 2.1 percent. Machinery orders are down 0.2 percent for the month. On the other hand, orders for computers are up 0.9 percent and communications equipment up 0.3 percent.
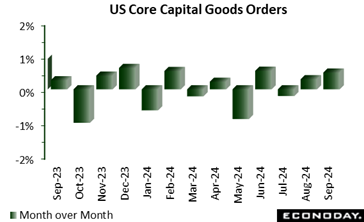
Core capital goods orders – nondefense capital goods excluding aircraft – are up 0.5 percent in September from August and up 0.3 percent in August from July. The underlying trend for new durables orders has a little upward momentum that could get a boost from hurricane recovery needs in the coming months.
Shipments of durables – are down 0.6 percent for September and also for August. This is also related to weakness in aircraft where the Boeing strike means fewer units are being completed and sent to customers. Excluding transportation, shipments are up 0.3 percent in September and up 0.2 percent in August.
Unfilled orders for durable goods are up 0.2 percent in September and up 0.2 percent in August. Manufacturers of durables have some orders in the pipeline to support future activity. Inventories of durable goods are down 0.2 percent in September after no change in August. Although conditions in the factory sector have been soft for some while, unwanted inventories are not accumulating.
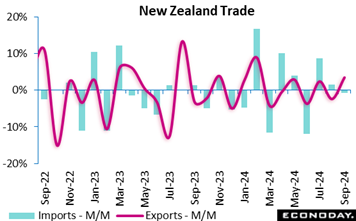 New Zealand's merchandise trade deficit narrowed from NZ$2,306 million in August to NZ$2,10-8 million in September. New Zealand's merchandise trade deficit narrowed from NZ$2,306 million in August to NZ$2,10-8 million in September.
Exports rose 3.5 percent on the month in September, rebounding strongly from a fall of 2.4 percent in August, and rose 5.2 percent on the year after previously falling2.5 percent. Fruit exports rose sharply on the year, with exports of dairy products and forestry products also recording solid increases. Exports to the European Union and the United States rose on the year, outweighed by declines in exports to Australia, China and other major Asian trading partners.
Imports fell 0.8 percent on the month in September, weakening from growth of 1.6 percent in August, and fell 0.9 percent on the year after dropping 1.2 percent previously. Petroleum imports fell 20.9 percent on the year, while imports of vehicles, parts and accessories also fell sharply, down 41.0 percent. Imports fell on the year from China, Japan and South Korea, offset by increases in imports from Australia, the United States and the European Union.
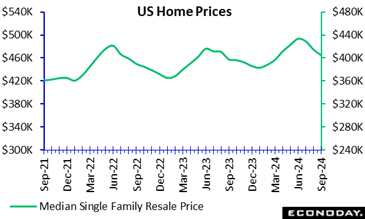 The NAR data on sales of existing homes in September shows a decrease of 1.0 percent to 3.84 million units at a seasonally adjusted annual rate compared to a small upward revision to 3.88 units in August. The September level is just below the consensus of 3.90 million units in the Econoday survey of forecasters. Compared to a year ago, sales are down 3.5 percent in September. The NAR data on sales of existing homes in September shows a decrease of 1.0 percent to 3.84 million units at a seasonally adjusted annual rate compared to a small upward revision to 3.88 units in August. The September level is just below the consensus of 3.90 million units in the Econoday survey of forecasters. Compared to a year ago, sales are down 3.5 percent in September.
While availability of homes for sale and prices are more favorable, homebuyers remain especially sensitive to changes in mortgage interest rates. The Freddie Mac rate for a 30-year fixed rate mortgage had a monthly average of about 6.44 percent in August, which is around the time borrowers would have secured a mortgage for closing a sale in September. In September the monthly average rate fell to 6.18 percent, while for October to date the average is about 6.38 percent. This suggests a boost to homebuying in the October sales report when that data is reported at 10:00 ET on Thursday, November 21.
The median price of an existing home is down 2.3 percent to $404,500 in September after $414,200 in August, but up 3.0 percent from $392,700 in September 2023. The median price of an existing home tends to decline in the second half of the year, but the underlying trend is still one of moderate price increases. The supply of homes available for sale is up to 4.3 months' worth in September, up from 4.2 in August and 3.4 in September 2023. It is the highest since 4.5 in May 2022 during the pandemic shutdown months and matches 4.3 in June 2019.
Sales of single-family existing homes are down 0.6 percent in September to 3.47 million units after 3.49 million units in August and down 2.3 percent from 3.55 million units in September 2023. Sales of condos and co-ops are down 5.1 percent in September to 370,000 units from 390,000 units in the prior month and down 14.0 percent year-over-year.
The listing of an existing home averaged 28 days on the market compared to 26 days in August and 21 days in September 2024. The lengthening of time on the market still suggests that while the pace of sales has slowed, it remains one in which units are moving steadily. First-time buyers accounted for 26 percent of all sales, the same as in August when it hit a record low share.
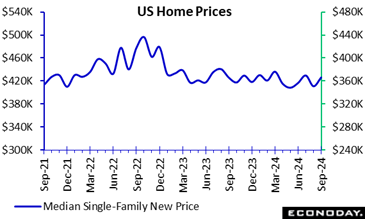 Sales of new single-family homes in September are up 4.1 percent to 738,000 at a seasonally adjusted annual rate after a small downward revision to 709,000 in August. The September level is above the consensus of 718,000 in the Econoday survey of forecasters. Sales are 6.3 percent higher than one year ago. The September level is the highest since 741,000 in May 2023. Sales rose 21.7 percent in the Northeast and 5.8 percent in the South, while sales are down 2.5 percent in the Midwest and unchanged in the West. Sales of new single-family homes in September are up 4.1 percent to 738,000 at a seasonally adjusted annual rate after a small downward revision to 709,000 in August. The September level is above the consensus of 718,000 in the Econoday survey of forecasters. Sales are 6.3 percent higher than one year ago. The September level is the highest since 741,000 in May 2023. Sales rose 21.7 percent in the Northeast and 5.8 percent in the South, while sales are down 2.5 percent in the Midwest and unchanged in the West.
Sales of new single-family homes got a boost in September from a drop in mortgage rates to an 18-month low for a 30-year fixed rate mortgage. The Freddie Mac rate for a 30-year fixed rate mortgage bottomed at 6.08 percent as of the September 26 week, falling from 6.35 percent in the September 5 week. The last time rates were this low was 6.09 percent in the week of February 2, 2023. Potential homebuyers who could move quickly and lock in the favorable rate were willing to purchase new construction where existing inventory was not available.
The months' worth of homes for sale dips to 7.6 in September from 7.9 in August but slightly above 7.5 months in September 2023. The median price for a new single-family home is up 3.7 percent in September to $426,300 from $410,900 in August, but essentially unchanged from a year ago.
The need to act quickly before mortgage rate locks expired increased the share of total sales of homes not yet started to 16 percent in September to the largest share since 18 percent in January. The share of homes sold that are under construction rose to 38 percent in September, the largest since 38 percent in March and 44 percent in February. The share of completed homes is down to 47 percent in September from 53 percent in August. Homebuilders were not only able to move some existing inventory, but also able to get some work in the pipeline as well as secure sales for projects currently under construction.
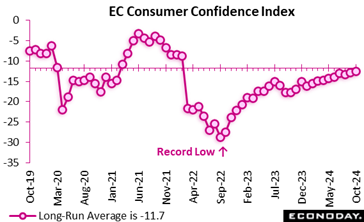 Consumer confidence improved further in October. A 0.4 point advance, its eighth rise in the last nine months, put the EU Commission's provisional index at minus 12.5, its strongest reading since February 2022. That said, this was 0.2 points short of the market consensus and also still below its minus 11.7 long-run average. Consumer confidence improved further in October. A 0.4 point advance, its eighth rise in the last nine months, put the EU Commission's provisional index at minus 12.5, its strongest reading since February 2022. That said, this was 0.2 points short of the market consensus and also still below its minus 11.7 long-run average.
The October update leaves a modestly rising trend in household sentiment that should bode well for stronger spending over coming months. However. for now, retail sales remain very sluggish, having barely changed over the year to date. If correct, increasing speculation about a jumbo interest rate cut from the ECB in December would certainly help matters but that is far from certain. Today's data also put the Eurozone's RPI at 2 and the RPI-P at minus 5, both measures showing overall economic activity performing much as the forecasters predicted.
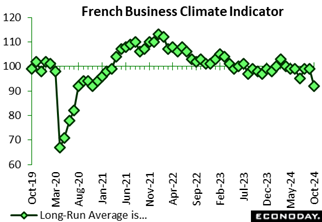 Manufacturing sentiment surprisingly deteriorated sharply in October. The headline fell fully seven points to 92, its to sharpest decline since the pandemic and well below its long-term average of 100. Past production, production expectations. Manufacturing sentiment surprisingly deteriorated sharply in October. The headline fell fully seven points to 92, its to sharpest decline since the pandemic and well below its long-term average of 100. Past production, production expectations.
Even though inventory levels have reached their highest point since 2023, workforce concerns remain. Future expectations have reached their lowest level since 2021, although past personnel changes have remained consistent. Supply-side obstacles have increased, affecting a quarter of companies, despite modest improvements in procurement.
Overall, the manufacturing sector continues to be burdened by economic uncertainty, weakening demand, and declining production.
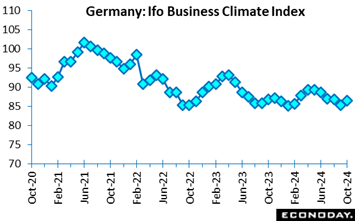 The business sentiment in the October Germany IFO survey has significantly improved, surpassing prior values, consensus expectations, and the projected range across key indicators. The business climate index increased from 85.4 in September to 86.5, indicating a rise in optimism despite economic challenges. This enhancement may indicate positive adjustments within businesses and an adaptive response to the stabilization of domestic and external factors. The business sentiment in the October Germany IFO survey has significantly improved, surpassing prior values, consensus expectations, and the projected range across key indicators. The business climate index increased from 85.4 in September to 86.5, indicating a rise in optimism despite economic challenges. This enhancement may indicate positive adjustments within businesses and an adaptive response to the stabilization of domestic and external factors.
The current economic assessment, as measured by current conditions, increased to 85.7, which significantly exceeded the consensus of 84.3. This implies that businesses perceive a current environment that is comparatively favourable, which may also have been influenced by resilient domestic demand.
Finally, business expectations increased from 86.3 to 87.3, surpassing the upper consensus range. This update suggests that businesses may anticipate additional growth or stabilization opportunities in the near future, suggesting a positive outlook. In general, the survey suggests that sentiment has improved across Germany's business sectors, which could have a positive impact on investment and operational decisions as we approach the final months of the year.
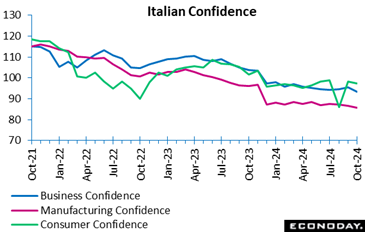 Overall business confidence declined in October. At 93.4, the Istat gauge was down from the revised 95.6 in September. Overall business confidence declined in October. At 93.4, the Istat gauge was down from the revised 95.6 in September.
Moreover, this gain was not mirrored in manufacturing where confidence dipped from a revised 86.7 to 85.8, its weakest point in 2024. However, construction gained ground (from 101.9 to 103.9), and retail trade also (from 102.3 to 103.7). Services on the other hand fell (from 100.4 to 95.3) mainly due to strong pessimism about the current business trend and the order book volume, both of which fell sharply this month.
Consumer confidence fell (from 98.3 to 97.4), mainly due to drops from the economic and future climate index. In summary, the report points to the shrinking of both business and consumer activity.
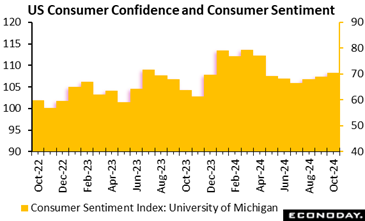 The final University of Michigan consumer sentiment index for October is 70.5 after 70.1 in September and 63.8 in October 2023. The October reading is above the consensus of 69.0 in the Econoday survey of forecasters. The final index is also an upward revision from the preliminary report of 68.9 in October. Overall, underlying consumer perceptions about the US economy are not much changed from the prior month. There's a slight upward momentum, but also restraint from uncertainties about the outcome of the US presidential election and if inflation is truly sufficiently tamed that the FOMC will continue to cut interest rates in the near future. The final University of Michigan consumer sentiment index for October is 70.5 after 70.1 in September and 63.8 in October 2023. The October reading is above the consensus of 69.0 in the Econoday survey of forecasters. The final index is also an upward revision from the preliminary report of 68.9 in October. Overall, underlying consumer perceptions about the US economy are not much changed from the prior month. There's a slight upward momentum, but also restraint from uncertainties about the outcome of the US presidential election and if inflation is truly sufficiently tamed that the FOMC will continue to cut interest rates in the near future.
The current economic conditions index is up to 64.9 in October, the highest since 65.9 in June. Worries about the labor market going cold are less – although not absent. The FOMC rate cut of 50 basis points on September 18 has meant some borrowing costs are lower but the initial optimism for further aggressive rate cuts has ebbed in financial markets and rates are rising again – notably mortgage interest rates. Recent upward price pressures for some food items have also sparked renewed worries about inflation even those these are likely to have short-term effects.
The expectations index for October is down slightly to 74.1 in October after 74.4 in September but is the second firmest since 76.0 in April. The contentious presidential race is keeping consumers in a state of uncertainty, but the better news about the labor market in the past month or two and ebbing recession fears are helping to keep perceptions about the future from falling steeply.
The 1-year inflation expectations measure is 2.7 percent in October, unchanged from October when it was the lowest since 2.5 percent in December 2020. Declines in gasoline prices are probably the reason for holding at a nearly four-year low. The 5-year inflation expectations measure is 3.0 percent in October, down a tenth from 3.1 percent in September. It has been essentially unchanged since the start of the year and moving in a narrow range that suggests medium-term inflation expectations are stable, if above the Fed's 2 percent inflation objective.
The global economy is broadly matching forecasts.
Moderate outperformance by the U.S. was mainly responsible for Econoday’s global Relative Economic Performance Index (RPI) holding in positive surprise territory (7) last week. Economic activity in China, the Eurozone, Japan and Switzerland is now largely moving in line with market expectations while the UK disappoints.
In the U.S., economic activity continues to outperform forecasts as it has for much of the period since early September. The RPI and RPI-P both closed out the week at 16. More of the same would further dent speculation about another cut in interest rates by the Federal Reserve in November.
In Canada, the RPI (minus 13) and RPI-P (minus 4) fell back below zero providing additional justification for the Bank of Canada’s 50 basis point cut in key interest rates. Without stronger growth and/or inflation, a further ease of at least 25 basis points is on the cards for December.
In the Eurozone, the combination of sluggish growth and surprisingly low inflation would seem to make another cut in ECB interest rates in December a done deal. At 5 and exactly zero respectively, the region’s RPI and RPI-P show economic activity in general meeting subdued growth expectations accompanied by falling inflation. A downside surprise on Thursday’s flash October HICP report would simply bolster speculation about a full 50 basis point ease.
In the UK, the signs of a sharper than anticipated slowdown in economic activity at the start of the current quarter saw the RPI decline to minus 20. The real economy is largely matching expectations - the RPI-P stands at 2 - but the recent surprisingly steep slowdown in inflation makes a November cut in Bank Rate very likely.
In Switzerland, a blank data calendar left the RPI at exactly zero and the RPI-P at 25. Ongoing disinflationary signals remain strong enough to sustain speculation about what would be a fourth consecutive cut in the Swiss National Bank’s policy rate in December.
In Japan, the RPI (9) slipped temporarily below zero before closing out the week back in positive surprise territory on the back of a surprisingly firm inflation update. No change in policy is expected at this week’s Bank of Japan announcement.
There were no important data released in China. However, with the RPI and RPI-P (currently both 7) showing a clear downside bias in recent months, the national central bank’s 25 basis point cut in key lending rates at the start of the week was always going to be just a matter of time.
**Contributing to this article were Jeremy Hawkins, Brian Jackson, Mace News, Max Sato, Olajide Oyadeyi, and Theresa Sheehan
Next week Monday, the Regional Federal Reserve bank manufacturing indicators are expected to contract In the US Dallas Fed manufacturing Survey for October. Forecasters expect another minus 9 index in October, unchanged from minus 9 in September.
On Tuesday, The US international trade goods (advanced) report is expected to show the goods deficit widened to $95.8 billion in September from $94.1 billion in August while the US consumer confidence index is estimated to drop to 98.7 in September from 105.6 in August. Forecasters look for a recovery to 99.1 in October, but sentiment is expected to remain depressed from summer levels.
Wednesday, French GDP for the third quarter is expected to rise 0.4 percent. Germany’s GDP is expected to contract 0.1 percent and Italy’s is expected to rise 0.3 percent in Q3. US GDP is expected to rise 3.0 over the quarter. US pending home sales are estimated to rise 1.0 percent this month for September.
Friday closes the last full week of data before the US Presidential election on Tuesday, November 5, with the one data release that could rise above all the clamor – the US employment report for October. The consensus forecast calls for a rise of 125,000 in payrolls for October. There are two special factors that might lead to a surprise.
The first is Hurricane Helene’s impact on large parts of the Southeast. Widespread devastation can make it difficult for the statistical agency to collect the normal data. Establishments may be hard to contact and unusual circumstances make it difficult to answer the standard questions. The same can be true of the household survey side. The BLS has experience dealing with this sort of challenge, but it may have an impact nonetheless. It may also result in more revisions than usual when the November data is released on December 6 at 8:30 ET.
The second is strike activity. There are two new strikes in aerospace that affect 38,000 workers. These workers will be deducted from October manufacturing payroll counts. Additionally, there is a new strike of 3,400 hotel workers which will be deducted from leisure and hospitality payrolls. These are one-time impacts. They will be added back in once each strike is settled, whenever that is. However, the strikes at Boeing and Textron may result in some layoffs and/or delays in hiring at businesses that are part of the chain of goods and services for aircraft manufacture. Businesses are reluctant to lose workers now who may be harder and/or most costly to replace later. But if the strike drags on, there could be effects in the coming weeks or months.
US Dallas Fed Manufacturing Survey for October (Mon 1030 EDT; Mon 1430 GMT)
Consensus Forecast, General Activity Index: -9
Consensus Range, General Activity Index: -9 to -1
Regional Federal Reserve bank manufacturing indicators have shown contraction continues around the country and the Dallas district is no exception. Forecasters expect another minus 9 index in October, unchanged from minus 9 in September.
Germany GfK Consumer Climate for November (Tue 0800 CEST; Tue 0700 GMT; Tue 0300 EDT)
Consensus Forecast, Index: -20.5
Consensus Range, Index: -21.4 to -19.0
Forecasters look for only modest improvement to minus 20.5 in the index as consumers remain gloomy.
US International Trade in Goods (Advance) for September (Tue 0830 EDT; Tue 1230 GMT)
Consensus Forecast, Balance: -$95.8 B
Consensus Range, Balance: -$101.0 B to -$93.0 B
The advance trade report is expected to show the goods deficit widened to $95.8 billion in September from $94.1 billion in August.
US Wholesale Inventories for September (Tue 0830 EDT; Tue 1230 GMT)
Consensus Forecast, M/M: 0.1%
Consensus Range, M/M: 0.0% to 0.2%
Wholesale inventories are expected up 0.1 percent in the latest month.
US Case-Shiller Home Price Index for August (Tue 0900 EDT; Tue 1300 GMT)
Consensus Forecast, 20-City Unadjusted – Y/Y: 5.2%
Consensus Range, 20-City Unadjusted – Y/Y: 5.0% to 5.9%
Housing price increases are expected to slow again to a 5.2 percent increase year-on-year after declining to 5.9 percent in July from 6.5 percent in June.
US FHFA House Price Index for August (Tue 0900 EDT; Tue 1300 GMT)
Consensus Forecast, M/M: 0.1%
Consensus Range, M/M: 0.0% to 0.2%
Expectations call for a muted 0.1 percent rise on the month.
US Consumer Confidence for October (Tue 1000 EDT; Tue 1400 GMT)
Consensus Forecast, Index: 99.1
Consensus Range, Index: 97.7 to 100.5
The consumer confidence index dropped to 98.7 in September from 105.6 in August as the mood darkened. Forecasters look for a recovery to 99.1 in October, but sentiment is expected to remain depressed from summer levels.
US JOLTS for September (Tue 1000 EDT; Tue 1400 GMT)
Consensus Forecast, Job Openings: 7.9 M
Consensus Range, Job Openings: 7.8 M to 8.0 M
Economists look for the labor market to ease slightly with job openings down to a 7.9 million rate in September from 8.0 million in August.
Australia Monthly CPI for September (Wed 1130 AEDT; Wed 0030 GMT; Tue 2030 EDT)
Consensus Forecast, CPI – Y/Y: 2.5%
Consensus Range, CPI – Y/Y: 2.3% to 2.5%
Forecasters look for CPI inflation to continue falling to a 2.5 percent rate in September after dipping to 2.7 percent in August from 3.5 percent in July.
Australia CPI for Q3 (Wed 1130 AEDT; Wed 0030 GMT; Tue 2030 EDT)
Consensus Forecast, CPI – Q/Q: 0.4%
Consensus Range, CPI – Q/Q: 0.1% to 0.5%
Consensus Forecast, CPI – Y/Y: 3.0%
Consensus Range, CPI – Y/Y: 2.8% to 3.0%
The consensus looks for a very moderate 0.4 percent rise in the third quarter after a 1.0 percent figure in Q2. The year-on-year increase is seen at 3.0 percent versus 3.8 percent in Q2.
France GDP Flash for Q3 (Wed 0730 CEST; Wed 0630 GMT; Wed 0230 EDT)
Consensus Forecast, Q/Q: 0.4%
Consensus Range, Q/Q: 0.2% to 0.4%
Forecasters expect decent 0.4 percent growth in the third quarter from the prior quarter.
Germany Unemployment Rate for October (Wed 0955 CEST; Wed 0855 GMT; Wed 0455 EDT)
Consensus Forecast, Rate: 6.1%
Consensus Range, Rate: 6.0% to 6.1%
Unemployment is expected to rise to 6.1 percent in October from 6.0 percent in September, suggesting the distress is not letting up for Europe’s largest economy.
Germany GDP Flash Q3 (Wed 1000 CEST; Wed 0900 GMT; Wed 0500 EDT)
Consensus Forecast, Q/Q: -0.1%
Consensus Range, Q/Q: -0.2% to 0.3%
Consensus Forecast, Y/Y: -0.2%
Consensus Range, Y/Y: -0.5% to -0.2%
Contraction again for Germany with the consensus for GDP at minus 0.1 percent in Q3 from Q2, and minus 0.2 percent from a year ago.
Italy GDP Flash Q3 (Wed 1000 CEST; Wed 0900 GMT; Wed 0500 EDT)
Consensus Forecast, Q/Q: 0.3%
Consensus Range, Q/Q: 0.3% to 0.3%
Consensus Forecast, Y/Y: 0.8%
Consensus Range, Y/Y: 0.7% to 1.2%
Forecasters see a better showing for Italy with GDP up 0.3 percent on the quarter and up 0.8 percent from a year ago.
Eurozone EC Economic Sentiment for October (Wed 1100 CEST; Wed 1000 GMT; Wed 0600 EDT)
Consensus Forecast, Economic Sentiment: 96.3
Consensus Range, Economic Sentiment: 95.7 to 96.6
Consensus Forecast, Industry Sentiment: -11.0
Consensus Range, Industry Sentiment: -11.5 to -10.0
Consensus Forecast, Consumer Sentiment: -12.5
Consensus Range, Consumer Sentiment: -13.0 to -12.5
Forecasters see Eurozone economic sentiment nearly flat at 96.3 and industry sentiment pretty steady at minus 11.0 from the prior month. Consumer sentiment is expected to be slightly better at minus 12.5 versus minus 12.9 in September.
US ADP Employment Report for October (Wed 0815 EDT; Wed 1215 GMT)
Consensus Forecast, Private Payrolls – M/M: 115,000
Consensus Range, Private Payrolls – M/M: 75,000 to 129,000
Job growth is expected to slow down with private payrolls up 115,000 in October.
US GDP for Q3 (Wed 0830 EDT; Wed 1230 GMT)
Consensus Forecast, Quarter over Quarter – Annual Rate: 3.0%
Consensus Range, Quarter over Quarter – Annual Rate: 2.1% to 3.5%
Consensus Forecast, Personal Consumption Expenditures – Annual Rate: 3.0%
Consensus Range, Personal Consumption Expenditures – Annual Rate: 2.0% to 3.6%
The economy remains resilient with GDP expected to show 3.0 percent growth in Q3 with personal spending up at the same rate.
Germany CPI for October (Wed 1400 CEST; Wed 1300 GMT; Wed 0900 EDT)
Consensus Forecast, M/M: 0.3%
Consensus Range, M/M: 0.1% to 0.3%
Consensus Forecast, Y/Y: 1.8%
Consensus Range, Y/Y: 1.8% to 1.9%
Consensus Forecast, HICP - M/M: 0.1%
Consensus Range, HICP - M/M: 0.1% to 0.2%
Consensus Forecast, HICP - Y/Y: 2.1%
Consensus Range, HICP - Y/Y: 2.1% to 2.2%
After no change in September from August, CPI is expected up 0.3 percent in October. The yearly headline figure is expected to go up 1.8 percent after September’s 1.6 percent. HICP is seen up 0.1 percent on the month and 2.1 percent from a year ago.
US Pending Home Sales Index for September (Wed 1000 EDT; Wed 1400 GMT)
Consensus Forecast, M/M: 1.0%
Consensus Range, M/M: -0.3% to 2.5%
Forecasters see pending home sales up 1.0 percent on the month.
Australia Retail Sales for September (Thu 1130 AEDT; Thu 0030 GMT; Wed 2030 EDT)
Consensus Forecast, M/M: 0.4%
Consensus Range, M/M: 0.3% to 0.6%
The consensus looks for retail sales up 0.4 percent on the month.
China CFLP PMI for October (Thu 0930 CST; Thu 0130 GMT; Wed 2130 EDT)
Consensus Forecast, Manufacturing Index: 50.0
Consensus Range, Manufacturing Index: 50.0 to 50.2
Consensus Forecast, Non-Manufacturing Index: 50.4
Consensus Range, Non-Manufacturing Index: 50.1 to 50.5
Forecasters look for modest improvement with the manufacturing PMI expected to sneak up to neutral at 50.0 and services slightly better at 50.4.
Germany Retail Sales for September (Thu 0800 CEST; Thu 0700 GMT; Thu 0300 EDT)
Consensus Forecast, M/M: -0.5%
Consensus Range, M/M: -1.2% to -0.4%
As German consumers remain loath to spend, forecasters look for retail sales down 0.5 percent on the month.
France CPI for October (Thu 0845 CEST; Thu 0745 GMT; Thu 0345 EDT)
Consensus Forecast, Y/Y: 1.2%
Consensus Range, Y/Y: 1.2% to 1.4%
The consensus looks for CPI up 1.2 percent from a year ago.
Eurozone HICP for October (Wed 1400 CEST; Wed 1300 GMT; Wed 0900 EDT)
Consensus Forecast, Y/Y: 1.9%
Consensus Range, Y/Y: 1.8% to 2.0%
Consensus Forecast, Narrow Core HICP - Y/Y: 2.6%
Consensus Range, Narrow Core HICP - Y/Y: 2.6% to 2.8%
Forecasters expect HICP to show a 1.9 percent rise on year with narrow core HICP up 2.6 percent.
Eurozone Unemployment Rate for September (Thu 1100 CEST; Thu 1000 GMT; Thu 0600 EDT)
Consensus Forecast, Rate: 6.4%
Consensus Range, Rate: 6.4% to 6.4%
No change expected in Eurozone unemployment at 6.4 percent.
Canada Monthly GDP for August (Thu 0830 EDT; Thu 1230 GMT)
Consensus Forecast, M/M: 0.0%
Consensus Range, M/M: -0.1% to 0.1%
It is not surprising the Bank of Canada chose to cut rates by 50 basis points last week as Canada’s economy continues to flatline. Forecasts call for no growth in August, in line with the StatsCan estimate.
US Jobless Claims (Thu 0830 EDT; Thu 1230 GMT)
Consensus Forecast, Initial Claims - Level: 235,000
Consensus Range, Initial Claims - Level: 227,000 to 245,000
Claims have receded to the range the market was familiar with before work stoppages and hurricanes skewed claims higher in the first part of October. The consensus looks for 235,000 in the latest week versus 227,000 in the week of October 19.
US Personal Income and Outlays for September (Thu 0830 EDT; Thu 1230 GMT)
Consensus Forecast, Personal Income - M/M: 0.4%
Consensus Range, Personal Income - M/M: 0.2% to 0.4%
Consensus Forecast, Personal Consumption Expenditures - M/M: 0.4%
Consensus Range, Personal Consumption Expenditures - M/M: 0.2% to 0.6%
Consensus Forecast, PCE Price Index - M/M: 0.2%
Consensus Range, PCE Price Index - M/M: 0.1% to 0.3%
Consensus Forecast, PCE Price Index - Y/Y: 2.1%
Consensus Range, PCE Price Index - Y/Y: 2.0% to 2.1%
Consensus Forecast, Core PCE Price Index - M/M: 0.3%
Consensus Range, Core PCE Price Index - M/M: 0.1% to 0.3%
Consensus Forecast, Core PCE Price Index - Y/Y: 2.6%
Consensus Range, Core PCE Price Index - Y/Y: 2.6% to 2.7%
Forecasters look for personal income and spending both to show a 0.4 percent rise on the month. PCE prices are expected up 0.2 percent on the month and by 2.1 percent from a year ago. The closely-watched core PCE price index is expected up 0.3 percent on the month and up 2.6 percent on the year.
US Employment Cost Index for Q3 (Thu 0830 EDT; Thu 1230 GMT)
Consensus Forecast, Q/Q: 1.0%
Consensus Range, Q/Q: 0.7% to 1.0%
Consensus Forecast, Y/Y: 4.1%
Consensus Range, Y/Y: 4.1% to 4.2%
ECI is seen up 1.0 percent on quarter and 4.1 percent from a year ago.
US Chicago PMI for October (Thu 0945 EDT; Thu 1345 GMT)
Consensus Forecast, Index: 47.3
Consensus Range, Index: 46.1 to 47.5
The Chicago PMI continues to bump along the bottom, expected at 47.3 in October versus 46.6 in September.
China PMI Manufacturing for October (Fri 0945 CST; Fri 0145 GMT; Thu 2145 EDT)
Consensus Forecast, Index: 49.7
Consensus Range, Index: 49.7 to 50.0
China’s PMI manufacturing index is expected at 49.7 versus 49.3 in September.
India PMI Manufacturing for October (Fri 1030 IST; Fri 0500 GMT; Fri 0100 EDT)
Consensus Forecast, Level: 57.4
Consensus Range, Level: 57.4 to 57.4
Forecasters see the manufacturing index at a robust 57.4 versus 56.5 in September and 57.4 in the October flash.
UK PMI Manufacturing for October (Fri 0930 BST; Fri 0930 GMT; Fri 0530 EDT)
Consensus Forecast, Level: 50.3
Consensus Range, Level: 50.3 to 50.3
The consensus looks for 50.3 for the UK PMI manufacturing index versus 51.5 a month ago and 50.3 in the October flash.
US Employment Situation for October (Fri 0830 EDT; Fri 1230 GMT)
Consensus Forecast, Nonfarm Payrolls - M/M: 125,000
Consensus Range, Nonfarm Payrolls - M/M: 67,000 to 180,000
Consensus Forecast, Unemployment Rate: 4.1%
Consensus Range, Unemployment Rate: 4.0% to 4.2%
Consensus Forecast, Private Payrolls - M/M: 90,000
Consensus Range, Private Payrolls - M/M: 40,000 to 160,000
Consensus Forecast, Manufacturing Payrolls - M/M: -30,000
Consensus Range, Manufacturing Payrolls - M/M: -35,000 to -5,000
Consensus Forecast, Average Hourly Earnings - M/M: 0.3%
Consensus Range, Average Hourly Earnings - M/M: 0.2% to 0.6%
Consensus Forecast, Average Hourly Earnings - Y/Y: 4.0%
Consensus Range, Average Hourly Earnings - Y/Y: 4.0% to 4.2%
Consensus Forecast, Average Workweek: 34.2 hrs
Consensus Range, Average Workweek: 34.1 hrs to 34.2 hrs
Strikes and hurricanes are expected to skew employment lower with total nonfarm payrolls up 125,000, down from September’s 254,000 increase. The jobless rate is expected flat at 4.1 percent. Hourly earnings are seen up by a trend-like 0.3 percent on the month.
US ISM Manufacturing Index for October (Fri 1000 EDT; Fri 1400 GMT)
Consensus Forecast, Index: 47.6
Consensus Range, Index: 47.1 to 48.0
Purchasing managers data are expected to show ongoing contraction with the ISM index nearly unmoved at 47.6 in October versus 47.2 in September.
US Construction Spending for September (Fri 1000 EDT; Fri 1400 GMT)
Consensus Forecast, M/M: 0.1%
Consensus Range, M/M: -0.2% to 0.5%
The consensus for construction spending looks for a modest 0.1 percent increase on the month.
|
