|
It was a thin data calendar in the US for the week. What did emerge from the numbers is that the outcome of the presidential election has lifted homebuilders’ optimism in early November for an easier regulatory environment that will help reduce construction costs. However, this is balanced against shortages of labor – even before a possible crackdown on immigrant workers – and possible increases in prices and supply chain delays for materials if new tariffs are imposed on China and elsewhere. Then there’s also the problem of finding land for building.
Housing starts and building permits in October showed some effect after the devastation of Hurricanes Helene and Milton. Planned residential construction probably was delayed in the Southeast and it may have been too soon to begin replacing housing stock destroyed by the storms. Some construction will have to wait for insurance payouts and/or local authorities to permit new homes. Recovery efforts will be competing for available material and labor for repairing existing structures.
Sales of existing homes have yet to feel the pinch of higher mortgage rates. Sales in October were largely from mortgages taken out in September and October. At that time monthly average for a Freddie Mac 30-year fixed rate mortgage was 6.2 percent and 6.5 percent respectively. So far in November the average is up to 6.8 percent.
Going forward, the housing market is likely to have to adapt for mortgage rates not coming down again soon. While it is widely expected that the FOMC will cut the fed funds target rate range another 25 basis points at the December 17-18 meeting, the pace of further cuts is likely to slow in 2025 as the Fed may be less confident that inflation is going to stay tamed without maintaining restrictive monetary policy.
 The euro area's final October annual inflation rate was 2.0 percent, unchanged from the flash estimate and up from September's 1.7 percent. Sectorally, services remained the primary driver, contributing 1.77 percentage points to the euro area's inflation. Meanwhile, energy prices acted as a counterbalance, subtracting 0.45 points. The euro area's final October annual inflation rate was 2.0 percent, unchanged from the flash estimate and up from September's 1.7 percent. Sectorally, services remained the primary driver, contributing 1.77 percentage points to the euro area's inflation. Meanwhile, energy prices acted as a counterbalance, subtracting 0.45 points.
Year-over-year, the unrevised narrow core rate was stable at the previous month's 2.7 percent, as was the wider measure that excludes just energy and unprocessed food. Elsewhere, the rate in non-energy industrial goods slightly rose to 0.5 percent, while energy (minus 4.6 percent after minus 6.1 percent) had a significant negative impact. By contrast, food, alcohol and tobacco had a positive effect (2.9 percent after 2.4 percent).
Regionally, headline inflation rose in France (1.6 percent after 1.4 percent), Germany (2.4 percent after 1.8 percent), Italy (1.0 percent after 0.7 percent) and Spain (1.8 percent after 1.7 percent). The Spanish, French, Italian and German rates were 0.1, 0.2, 0.3 and 0.6 percentage points higher than in September. Inflation in Italy, France and Spain is below the ECB's target, while Germany moved above.
Confirmation of the October data should leave the ECB on course to ease again next month but a 25 basis point cut still looks slightly more likely than a 50 basis point move.
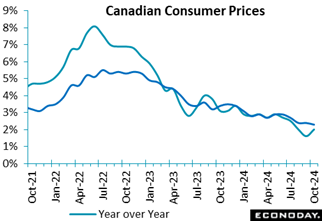 Canada's Consumer Price Index jumped 0.4 percent in October on a monthly basis, erasing a 0.4 percent decline in September, higher than expectations for a 0.3 percent rise in the Econoday survey of forecasters. Canada's Consumer Price Index jumped 0.4 percent in October on a monthly basis, erasing a 0.4 percent decline in September, higher than expectations for a 0.3 percent rise in the Econoday survey of forecasters.
Compared to October 2023, the CPI is up 2 percent, climbing further after a 1.6 percent gain in September, and just beating expectations for a 1.9 percent rise in the Econoday survey of forecasters.
Excluding food and energy prices, the CPI rose 0.5 percent on a monthly basis, compared to a 0.1 percent drop in September. Compared to a year ago, the core CPI is up 2.3 percent in October vs. a 2.4 percent increase in September.
The inflation data is in line with the Bank of Canada's outlook for consumer prices, with the central bank expecting inflation to remain close to its 2 percent target. This means a continuation of its plans to cut its target interest rate so long as inflation stays "close to the middle" of the 1 percent to 3 percent range.
The uptick in headline annual inflation is because of a smaller decline in prices for gasoline. Compared to a year ago, gasoline prices fell 4 percent in October compared with September's decline of 10.7 percent. Consumer prices excluding gasoline rose 2.2 percent last month, the same growth rate as in August and September. On a monthly basis, gasoline prices are up 0.7 percent in October following a 7.1 percent decline in September.
Shelter price growth continued to slow down in October, rising 4.8 percent year over year, compared with a 5 percent increase in September.
Prices for goods rose 0.1 percent from a year ago in October, following a 1 percent drop in September. Meanwhile, prices for services dropped off the pace in October, rising 3.6 percent, the smallest annual increase since January 2022.
The average of the Bank of Canada's 'Alternative measures' of annual core inflation for October is 2.4 percent.
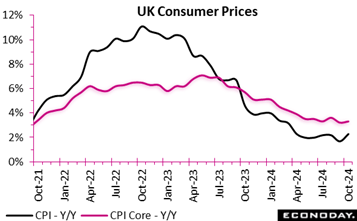 In October, inflationary pressures intensified, with consumer prices increasing by 2.3 percent annually. This was up from 1.7 percent in September, a tick stronger than the market consensus and 0.3 percentage points above its medium-term target. Monthly, the CPI rose by 0.6 percent following no change in September. The consumer price index including owner occupiers' housing costs (CPIH) mirrored this trend, climbing to 3.2 percent year-over-year, driven largely by housing and household services, particularly surging electricity and gas prices. In October, inflationary pressures intensified, with consumer prices increasing by 2.3 percent annually. This was up from 1.7 percent in September, a tick stronger than the market consensus and 0.3 percentage points above its medium-term target. Monthly, the CPI rose by 0.6 percent following no change in September. The consumer price index including owner occupiers' housing costs (CPIH) mirrored this trend, climbing to 3.2 percent year-over-year, driven largely by housing and household services, particularly surging electricity and gas prices.
Core inflation, which excludes volatile items like energy and food, highlighted a still firm underlying picture. Hence, the yearly core rate edged up to 3.3 percent from 3.2 percent and was also on the strong side of the market consensus. The core CPIH reached 4.1 percent annually. Despite these increases, recreation and culture costs provided some relief, acting as a partial offsetting factor.
Goods inflation rebounded, with the annual rate rising from minus 1.4 percent to minus 0.3 percent. The key services sector also saw a modest rise, increasing from 4.9 percent to 5.0 percent, albeit only a 2-month high.
These figures, particularly the pick-up in underlying inflation, increase the likelihood of the December BoE MPC holding Bank Rate at the current 4.75 percent. In the main, price still trends look to be moving in the right direction but, with Budget effects to come, October's data offer no room for complacency.
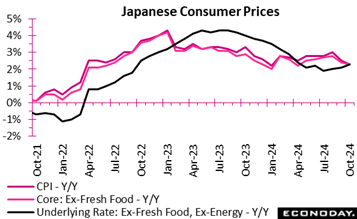 Consumer inflation in Japan eased to a six-month low of 2.3% in the core reading in October (vs. consensus 2.2%) to match the 2.2% annual rate in April, decelerating from 2.4% in September and 2.8% in August. The government's temporary revival of utility subsidies for suppliers is lowering electricity and natural gas bill payments from September until November but its effects were somewhat offset by higher costs for processed food amid rice shortages. Consumer inflation in Japan eased to a six-month low of 2.3% in the core reading in October (vs. consensus 2.2%) to match the 2.2% annual rate in April, decelerating from 2.4% in September and 2.8% in August. The government's temporary revival of utility subsidies for suppliers is lowering electricity and natural gas bill payments from September until November but its effects were somewhat offset by higher costs for processed food amid rice shortages.
The year-on-year rise in the CPI was also fueled by higher property insurance costs and the markup in subscription fees to NHK public broadcaster that took effect on Oct. 1.
Ruling party officials are considering resuming a similar scheme nearly next year to help ease the pain of many households hit by high costs for necessities for more than two years in light of the pandemic-era global supply chain breakdown and Russia's war in Ukraine.
The year-on-year increase in the total CPI stood at 2.3%, down from 2.5% in September, as expected. Underlying inflation measured by the core-core CPI (excluding fresh food and energy) was 2.3%, up from 2.1% the previous month, as this relatively younger series is unaffected by energy prices and reflects higher labor costs.
The CPI increase was led by higher costs for processed food +3.8% y/y (+0.92 point contribution) in October vs. +3.1% (+0.73 point) in September, overall energy +2.3% (+0.17 point) in October vs. +6.0% (+0.44 point) in September, property insurance premiums +7.0% (+0.09 point) vs. +2.7% +0.02 point) and subscription to NHK public television unchanged (zero contribution) vs. -10.2% (-0.4 point).
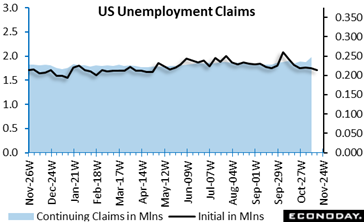 Initial jobless claims fell again in the latest week, down 6,000 in the week ending November 16 from the upwardly revised 219,000 level (previously 217,000) reported for the prior week. The November 16 week's level is again below the consensus of 219,000 in the Econoday survey of forecasters. Initial jobless claims fell again in the latest week, down 6,000 in the week ending November 16 from the upwardly revised 219,000 level (previously 217,000) reported for the prior week. The November 16 week's level is again below the consensus of 219,000 in the Econoday survey of forecasters.
The four-week moving average is down 3,750 to 217,750 in the November 16 week, after a revised 221,500 in the prior week.
Seasonal factors had expected a drop in unadjusted claims of 12,457 (5.4 percent) from the previous week, but the actual decline was larger than expected - 17,750 or -7.7 percent.
There was a noticeable drop in first-time claims filed in California, Georgia, New Jersey, and Texas.
Insured unemployment is up 36,000 in the November 9 week to 1.908 million, after a downwardly revised 1.872 million in the prior week – and continuing claims are up 113,000 from the same week a year ago, underscoring the current softness in the labor market. The four-week moving average is up 5,000 to 1.879 million, after an downwardly revised 1.874 million in the November 2 week. The insured rate of unemployment remains steady at 1.2 percent in the November 2 week and has seen almost no variation since March 2023.
The elevated number of those who continue to receive unemployment benefits compared to a year ago underscores the growing difficulty in finding new employment. In the absence of evidence that the progress has stalled on slowing down the inflation rate, this data point will support the Federal Open Market Committee's decision to cut rates again in December.
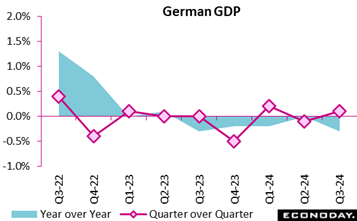 Germany's GDP rose by 0.1 percent in the third quarter of 2024, a 0.1 percentage point downward revision to the provisional estimates and making for a very modest recovery after a subdued first half of the year. This marks a minor improvement from the minus 0.3 percent revised decline in the second quarter but remains 0.3 percent lower than a year earlier. Germany's GDP rose by 0.1 percent in the third quarter of 2024, a 0.1 percentage point downward revision to the provisional estimates and making for a very modest recovery after a subdued first half of the year. This marks a minor improvement from the minus 0.3 percent revised decline in the second quarter but remains 0.3 percent lower than a year earlier.
Household and government spending provided slight boosts, with consumption up 0.3 percent quarter-over-quarter. However, gross fixed capital formation in machinery and construction declined further, dampening investment growth. Exports dropped significantly by minus 1.9 percent while imports rose by 0.2 percent ensuring a negative contribution from net foreign trade.
Sectoral trends were mixed. Manufacturing and construction faced sharp contractions, whereas public services, education, and health showed resilience. The service sector grew overall year-over-year, driven by gains in information and communication.
Labour productivity stagnated, and employment saw its first seasonally adjusted decline since 2021. Nonetheless, nominal incomes rose by 2.8 percent, with a higher savings rate (10.6 percent) reflecting cautious consumer behaviour.
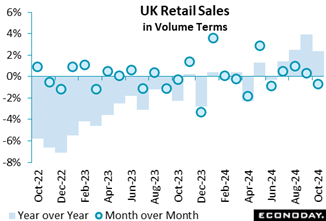 Retail sales volumes in October fell by 0.7 percent on the month, 0.4 percentage points less than the consensus, and more than reversing the modest 0.1 percent rise seen in September (revised from 0.3 percent). Non-food stores were particularly affected, as budget uncertainties weighed on consumer spending. Despite the monthly dip, broader trends showed resilience, with sales volumes rising by 0.8 percent in the three months to October compared to the preceding three months. Year-over-year growth reached 2.4 percent, 0.8 percentage points below the consensus and prior revision for the previous month, marking a recovery from the disruptions caused by the pandemic, though volumes remained 1.5 percent below February 2020 levels. Retail sales volumes in October fell by 0.7 percent on the month, 0.4 percentage points less than the consensus, and more than reversing the modest 0.1 percent rise seen in September (revised from 0.3 percent). Non-food stores were particularly affected, as budget uncertainties weighed on consumer spending. Despite the monthly dip, broader trends showed resilience, with sales volumes rising by 0.8 percent in the three months to October compared to the preceding three months. Year-over-year growth reached 2.4 percent, 0.8 percentage points below the consensus and prior revision for the previous month, marking a recovery from the disruptions caused by the pandemic, though volumes remained 1.5 percent below February 2020 levels.
While the monthly decline reflects immediate pressures, the annual and quarterly growth signals cautious optimism for the retail sector. These figures continue to highlight ongoing adjustments in consumer behaviour and economic dynamics post-pandemic.
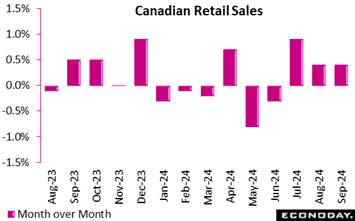 Canada retail sales increased 0.4 percent in September, matching the pace set in August, and as expected in the Econoday consensus forecast. Statscan said sales were up in six of nine subsectors, led by increased sales for food and beverage retailers. Canada retail sales increased 0.4 percent in September, matching the pace set in August, and as expected in the Econoday consensus forecast. Statscan said sales were up in six of nine subsectors, led by increased sales for food and beverage retailers.
Retail sales are up 0.8 percent from September 2023, slowing down from the 1.4 percent jump on an annual basis in August.
Core retail sales, excluding gasoline stations, fuel vendors and auto dealers, rebounded in September – surging by 1.4 percent after a 0.5 percent decline in August. Core sales rose 1.9 percent compared to September 2023, a significant improvement on the 0.3 percent year-over-year increase reported for August.
September's retail sales data keeps another rate cut on the table at the Bank of Canada's next meeting in December but makes an aggressive move less likely. Still, it will take some time for lower borrowing costs to reverse the decline in consumer spending, with overall consumption not expected to pick up until the second half of 2025.
On a monthly basis, September's largest increase in retail sales was at food and beverage retailers (+3 percent). Higher sales at supermarkets and other grocery retailers (+3.3 percent) led the increase, followed by beer, wine, and liquor retailers (+4.4 percent). The only category within core retail sales that saw a decline in September was clothing, clothing accessories, shoes, jewelry, luggage and leather goods retailers (-0.8 percent).
Sales at gasoline stations and fuel vendors were down 2.3 percent in September, the fifth consecutive monthly decline. Sales at motor vehicle and parts dealers fell 0.7 percent in September, dragged down by both new car dealers (-0.7 percent) and used car dealers (-5.2 percent).
E-commerce sales bounced back in September – up 3.3 percent following a 2.5 percent drop in August – making up 6.2percent of total retail trade – compared with 6 percent in August.
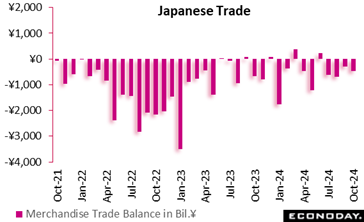 Japanese export values rose 3.1% in October after falling 1.7% in September, which was their first year-on-year drop in 10 months. The headline figure came in largely in line with the consensus call of +3.0% (range: -1.0% to +8.6%). The modest export gain was led by solid demand for semiconductor-producing equipment, drugs and optical equipment, which were partly offset by drops in mineral fuels, auto parts and iron/steel. Japanese export values rose 3.1% in October after falling 1.7% in September, which was their first year-on-year drop in 10 months. The headline figure came in largely in line with the consensus call of +3.0% (range: -1.0% to +8.6%). The modest export gain was led by solid demand for semiconductor-producing equipment, drugs and optical equipment, which were partly offset by drops in mineral fuels, auto parts and iron/steel.
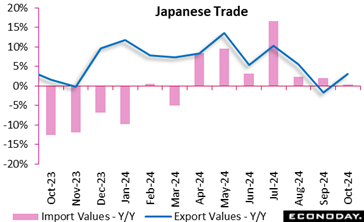
Import values marked their seventh straight increase, up a slight 0.4%, following a 1.8% rise the previous month. It was much stronger than the median economist forecast of a 1.8% drop (range: -6.5% to +4.4%). Strong demand for computers, non-ferrous metal and telecommunications equipment (smartphones) was mostly cancelled by lower purchases of crude oil, coal and semiconductors.
The trade data provided a slightly bright spot: a rebound in shipment volumes. It indicates a better net export performance in the October-December GDP data. Export volumes were up 0.1% on year, showing their first rise in nine months while import volumes rose 2.5% for their first gain in three months. In the third quarter GDP data released last week, external demand (exports minus imports) pushed down total domestic output by 0.4 percentage point, marking the third straight quarter of providing a negative contribution. Japan's third quarter economic growth slowed to 0.2% on quarter, on pullbacks in business investment and public works spending, as expected, but an unexpected slip in external demand amid sapping Chinese demand and global uncertainties was offset by surprisingly solid consumer spending on vehicles amid high costs for necessities and stormy Q3 weather.
The trade balance posted a ¥461.2 billion deficit for a fourth consecutive shortfall. It was wider than the consensus call of a ¥132.2 billion red ink (range: a deficit of ¥360.4 billion to a surplus of ¥54.5 billion) and a revised ¥294.1 billion deficit in September, but was still much narrower than the ¥702.86 billion deficit in October 2023 and a record shortfall of ¥3,506.43 billion (¥3.51 trillion) in January 2023.
Shipments to China, a key export market for Japanese goods, rose 1.5%, after marking their first fall in 10 months with a 7.3% slump in September. The increase reflects a pickup in demand for semiconductor-producing equipment, computer chips and optical equipment (steppers for chips). However, shipments of automobiles, auto parts and organic compounds (cosmetics) were down as consumption in the world's second largest economy remains sluggish.
Japanese exports to the European Union fell 11.3% for the seventh straight fall amid sluggish demand for automobiles, ships and construction machinery. Exports to the United States slipped 6.2% for their third straight drop in light of resilient but cooling U.S. economic growth. The decrease was due to lower demand for autos, auto parts and construction/mining equipment. Shipments of drugs showed a sharp increase. Exports to the U.S. recorded their first year-on-year decline in 35 months in August.
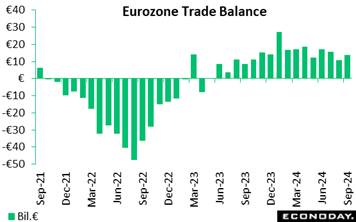 In September, the euro area recorded a robust trade surplus as seasonally adjusted exports rose by 0.4 percent and imports dropped by 0.8 percent month-over-month. This saw the surplus widen to €13.6 billion from a downwardly revised €10.8 billion in August. Similarly, the EU reported a rise in its surplus, from €8.1 billion to €11.0 billion, driven by a sharper decline in imports than exports. In September, the euro area recorded a robust trade surplus as seasonally adjusted exports rose by 0.4 percent and imports dropped by 0.8 percent month-over-month. This saw the surplus widen to €13.6 billion from a downwardly revised €10.8 billion in August. Similarly, the EU reported a rise in its surplus, from €8.1 billion to €11.0 billion, driven by a sharper decline in imports than exports.
Year-over-year data show a limited improvement in the region's trade dynamics with exports increasing by 0.6 percent and imports decreasing by 0.6 percent. Cumulatively, from January to September 2024, the euro area achieved a surplus of €140.8 billion, a marked increase on the €13.9 billion posted in the same period of 2023 but mainly due to a 5.6 percent drop in imports.
The EU mirrored these trends, with extra-EU exports up by 0.8 percent and imports slightly lower. Product-wise, machinery and vehicles led the surplus gains, while reduced energy deficits underscored diversification efforts.
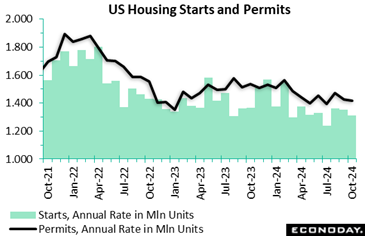 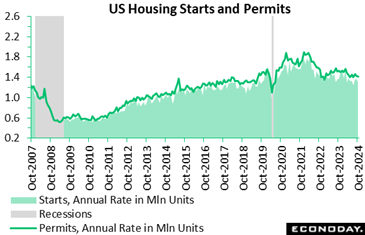 Starts of new homes in October are down 3.1 percent to 1.311 million units at a seasonally adjusted annual rate after 1.353 million units in September, and down 4.0 percent from 1.365 million units in October 2023. The October level is close to the consensus of 1.300 million units in the Econoday survey of forecasters. Some housing starts may have been delayed by the impacts of Hurricanes Helene and Milton as resources were diverted to disaster recovery efforts. However, the decline also reflects soft conditions as homebuilders adjust to less demand for new single-family homes at a time when mortgage rates are less favorable and there is more existing housing stock to compete for buyers. Starts of new homes in October are down 3.1 percent to 1.311 million units at a seasonally adjusted annual rate after 1.353 million units in September, and down 4.0 percent from 1.365 million units in October 2023. The October level is close to the consensus of 1.300 million units in the Econoday survey of forecasters. Some housing starts may have been delayed by the impacts of Hurricanes Helene and Milton as resources were diverted to disaster recovery efforts. However, the decline also reflects soft conditions as homebuilders adjust to less demand for new single-family homes at a time when mortgage rates are less favorable and there is more existing housing stock to compete for buyers.
Single-family home starts are down 6.9 percent to 970,000 units in October from September and down 0.5 percent from 975,000 a year ago. The period of uncertainty in the weeks leading up to the US presidential election meant that homebuilders and potential buyers were cautious about committing to a new home. That is likely to change in November, although mortgage rates remain elevated with few expectations of another dip in the near future.
Multi-unit home starts are up 9.6 percent to 341,00 in October from the prior month, and down 12.6 percent from 390,000 in October 2023. Overall, levels of starts for multi-units remain low at a time when the pool of homebuyers are more likely to opt for a single-family unit.
Permits issued in October are down 0.6 percent to 1.416 million after an essentially unrevised 1.425 million in September, and are down 7.7 percent from 1.534 million in October 2023. The October level is a near match with the consensus of 1.400 million in the Econoday survey. Again, there are probably some impacts from the hurricanes that devastated large parts of the Southeast. After a trickle in October, in November, the number of permits is likely to rise as homes flattened by storms are bulldozed and rebuilt from the ground-up.
Permits issued for single-family homes is up 0.5 percent in October to 968,000 and down 1.8 percent from 986,000 in October 2023. The number of permits issued has been essentially unchanged for the last three months, suggesting relatively stable demands for new construction of single-family units. Multi-unit permits are down 3.0 percent to 448,000 in October and down 18.2 percent from 548,000 a year ago. Demand for multi-unit projects tends to be quite uneven.
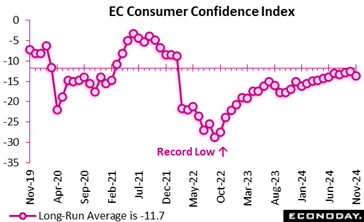 The flash estimate for the Euro Area consumer confidence indicator in November reveals a decline of 1.2 percentage points, dropping from minus 12.5 in October to minus 13.7. This decline was 1.6 percentage points more than the market consensus and this downturn marks a fall back below the long-term average of minus 11.7, reflecting growing uncertainty among consumers. The flash estimate for the Euro Area consumer confidence indicator in November reveals a decline of 1.2 percentage points, dropping from minus 12.5 in October to minus 13.7. This decline was 1.6 percentage points more than the market consensus and this downturn marks a fall back below the long-term average of minus 11.7, reflecting growing uncertainty among consumers.
This latest report indicates that confidence remains fragile, possibly influenced by external economic pressures, such as rising inflationary trends in the run-off to December, which may have dampened household spending intentions and economic outlook. This shift is likely to prompt closer scrutiny by policymakers, as weakened consumer confidence can lead to reduced spending, further slowing economic growth.
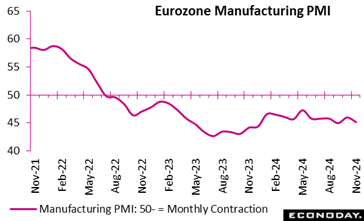 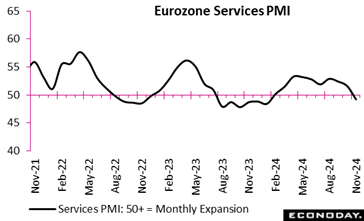 The Eurozone's economic activity contracted in November, with the flash composite PMI dropping to a 10-month low of 48.1, some 2.1 points below the consensus forecast and signalling the sharpest decline since January. Business activity fell across both manufacturing and services sectors, marking a renewed slump in demand. Manufacturing output, down for the 20th consecutive month, declined at an accelerated pace, 0.8 points faster decline than consensus, while services activity contracted for the first time in 10 months, albeit modestly. The Eurozone's economic activity contracted in November, with the flash composite PMI dropping to a 10-month low of 48.1, some 2.1 points below the consensus forecast and signalling the sharpest decline since January. Business activity fell across both manufacturing and services sectors, marking a renewed slump in demand. Manufacturing output, down for the 20th consecutive month, declined at an accelerated pace, 0.8 points faster decline than consensus, while services activity contracted for the first time in 10 months, albeit modestly.
New orders fell at the fastest rate in 2024, driven by weakening domestic and export demand. Confidence hit its lowest point since September 2023, with sentiment among service providers especially subdued. Pessimism prevailed in France, which experienced its steepest contraction since January, while Germany's activity also declined. The rest of the Eurozone saw only slight growth, marking the slowest expansion in 11 months.
Employment trends diverged, with manufacturing job cuts reaching the highest level since August 2020, while services added jobs at a four-month high. Inflation pressures ticked up, driven by rising service sector costs, while manufacturing prices declined amid weak demand. Inventories and purchasing activity also contracted sharply.
The global economy is now meeting market expectations.
Econoday’s Relative Economic Performance Index (RPI) ended the week at minus 3, indicating that recent global activity has behaved much as forecast. The U.S. continues to lead the pack ahead of Canada, but while China and Japan have offered few surprises, underperformance by the Eurozone and the UK has become more marked.
In the U.S., the latest releases were, on balance, on the firm side of market expectations and the RPI and RPI-P (both 17) were little changed on the week. Economic activity in general continues to outperform modestly, supporting Federal Reserve Chair Jerome Powell’s view that the central bank need be in no hurry to lower interest rates.
In Canada, a suite of stronger than expected data lifted both the RPI (8) and RPI-P (1) back into positive surprise territory. However, neither reading is much above zero, meaning that economic activity in general is only marginally outpacing the consensus. The reports will not dent widespread speculation about another cut in Bank of Canada interest rates in December.
In the Eurozone, early evidence of a surprisingly poor November for economic activity saw the RPI drop to minus 31 and the RPI-P to minus 44. Both values constitute 5-month lows and can only add to pressure on the ECB to ease again in December. The Governing Council is probably split between a 25 basis point or 50 basis point cut so Friday’s November flash HICP report will be all the more important.
In the UK, the RPI (minus 24) and RPI-P (minus 34) similarly slipped further below zero on the back of further signs that the economy has lost more momentum than anticipated this quarter. Even so, with October inflation surprising on the upside, the chances of another cut in Bank Rate next month have still receded.
In Switzerland, the absence of any significant market data left the RPI at minus 35 and the RPI-P at minus 25. The Swiss National Bank maintains that a December ease is not a done deal but it will take some surprisingly strong data between now and then to convince financial markets that at least a 25 basis point cut in the policy rate is not just around the corner.
In Japan, October inflation was slightly firmer than forecast but the RPI (minus 4) and RPI-P (minus 21) both lost ground and show overall economic activity falling somewhat short of market forecasts. The jury is still out on the timing of the next Bank of Japan tightening.
In China, an essentially blank data calendar made for no change in either the RPI (zero) or the RPI-P (20). If both measures can avoid falling back into negative surprise territory, it might mean that prime loan rates, which were left on hold last week, are either at, or very close to, the bottom of the current cycle.
**Contributing to this article were Jeremy Hawkins, Brian Jackson, Mace News, Max Sato, Olajide Oyadeyi, and Theresa Sheehan
Starting off Monday is the German Ifo survey. German business morale is expected to retreat in the November report with the business climate index at 86.0 after rising more than expected to 86.5 in October from 85.4 in September. Current conditions are seen at 85.5 and expectations at 87.0 in November, down from 85.7 and 87.3 in October, respectively.
Tuesday, US S&P Case-Shiller house price index is expected to decline in the rate of annual home price inflation with the 20-city composite index at 5.2 percent in August compared with 5.9 percent in July. Forecasters look for more slowing/ to 4.8 percent in September. Month on month, the call is a moderate 0.3 percent increase versus 0.4 percent in the prior month.
The US FHFA house price index on the other hand calls for a modest 0.2 percent rise on the month after a 0.3 percent increase the month before.
US consumer confidence is expected to extend its remarkable recovery in November after its surprising rebound to 108.7 in October from 99.2 in September. Markets are focusing on consumer views of the job market, which improved markedly in October, now that inflation worries have diminished.
On the same day, US new home sales are expected to fall back to a 725,000 annual rate in October after rising to 738,000 in September from 709,000 in August. Buyers were lured by lower mortgage rates in September, but rates ticked up again in October and continued higher in November, by the way.
Wednesday, New Zealand’s RBNZ is expected to cut the official cash rate by 50 basis points to 4.25 percent. The RBNZ has cut rates by a total of 75 basis points at the last two meetings as inflation has dropped into the 1-3 percent target range and the economy has slowed sharply.
US pending home sales are forecast to be down 1.8 percent on the month in October after a big 7.4 percent rise in September. Mortgage rates were down in September and back up in October.
German consumer price index is estimated to be up 0.2 percent on the month and up 2.3 percent on the year in the initial November reading.
Friday, Japanese payrolls are expected to post their 27th straight rise on the year in October amid labor shortages in many sectors. The unemployment rate is forecast unchanged at 2.4% after improving further to an eight-month low of 2.4% in September from 2.5% in August and 2.7% in July. In October, public pension and healthcare coverage for part-time workers was expanded to include those who work at smaller firms that have 51 to 100 people on payrolls. This might have encouraged more people to begin looking for work, thus being counted as unemployed in the labor market, but that factor alone is unlikely to have pushed up the unemployment rate.
That same day, Japan's industrial production is forecast to post a second straight rise, up 3.9% on the month in October, after rebounding an upwardly revised 1.6% in September and plunging 3.3% in August. METI's survey of producers indicated that output would rise a solid 5.1% in October, led by manufacturers of production machinery and transport equipment (Toyota had resumed output of some models after suspending it over safety check concerns), before falling 3.7% in November on expected lower production of production machinery and semiconductors.
From a year earlier, factory output is expected to post its first increase in three months, up 2.1%, following a 2.6% drop (revised from -2.8%) in September.
Lastly, for the Eurozone HICP flash for November; base effects are expected to lift Eurozone headline inflation with HICP up 2.3 percent and narrow core up 2.8 percent in the latest month versus 2.0 percent and 2.7 percent a month ago.
New Zealand Retail Trade for Third Quarter (Mon 1045 NZDT; Sun 2145 GMT; Sun 1645 EST)
Consensus Forecast, Q/Q: -0.5%
Consensus Range, Q/Q: -0.5% to -0.5%
Households have been cutting back on retail spending so far this year in response to weakening household finances and forecasters see the pattern continuing into the third quarter. The consensus looks for retail trade to fall 0.5 percent in the third quarter from the second quarter after falling 1.2 percent in the second quarter from the prior quarter.
Germany Ifo Survey for November (Mon 1000 CEST; Mon 0900 GMT; Mon 0400 EST)
Consensus Forecast, Business Climate: 86.0
Consensus Range, Business Climate: 85.0 to 86.7
Consensus Forecast, Current Conditions: 85.5
Consensus Range, Current Conditions: 85.2 to 85.6
Consensus Forecast, Business Expectations: 87.0
Consensus Range, Business Expectations: 86.0 to 87.5
German business morale is expected to retreat in the November report with the business climate index at 86.0 after rising more than expected to 86.5 in October from 85.4 in September. Current conditions are seen at 85.5 and expectations at 87.0 in November, down from 85.7 and 87.3 in October, respectively.
US Dallas Fed Manufacturing Survey for November (Mon 1030 EST; Mon 1530 GMT)
Consensus Forecast, General Activity Index: -3.9
Consensus Range, General Activity Index: -6.0 to 1.0
Forecasters see the general business activity index staying in contraction territory at minus 3.9 in November, not much of a change from minus 3.0 in October, and versus minus 9.0 in September.
US S&P Case-Shiller Home Price Index for September (Tue 0900 EST; Tue 1400 GMT)
Consensus Forecast, 20-City Adjusted - M/M: 0.3%
Consensus Range, 20-City Adjusted - M/M: 0.3% to 0.4
Consensus Forecast, 20-City Unadjusted - Y/Y: 4.8%
Consensus Range, 20-City Unadjusted - Y/Y: 4.5% to 4.9%
S&P Case Shiller has been reporting a steady decline in the rate of annual home price inflation with the 20-city composite index at 5.2 percent in August compared with 5.9 percent in July. Forecasters look for more slowing/ to 4.8 percent in September. Month on month, the call is a moderate 0.3 percent increase versus 0.4 percent in the prior month.
US FHFA House Price Index for September (Tue 0900 EST; Tue 1400 GMT)
Consensus Forecast, M/M: 0.2%
Consensus Range, M/M: 0.2% to 0.3%
Forecasts call for a modest 0.2 percent rise on the month after a 0.3 percent increase the month before.
US Consumer Confidence for November (Tue 1000 EST; Tue 1500 GMT)
Consensus Forecast, Index: 112.3
Consensus Range, Index: 105.0 to 115.0
The consensus looks for consumer confidence to extend its remarkable recovery in November after its surprising rebound to 108.7 in October from 99.2 in September. Markets are focusing on consumer views of the job market, which improved markedly in October, now that inflation worries have diminished.
US New Home Sales for October (Tue 1000 EST; Tue 1500 GMT)
Consensus Forecast, Annual Rate: 725K
Consensus Range, Annual Rate: 710K to 750K
Home sales are seen falling back to a 725,000 annual rate in October after rising to 738,000 in September from 709,000 in August. Buyers were lured by lower mortgage rates in September, but rates ticked up again in October and continued higher in November, by the way.
US Richmond Fed Manufacturing Index for November (Tue 1000 EST; Tue 1500 GMT)
Consensus Forecast, Index: -8.0
Consensus Range, Index: -11.0 to -1.0
Some slowing in the ongoing rate of contraction is the call with the index at minus 8.0 in November versus minus 14.0 in October.
Australia Monthly CPI for October (Wed 1130 AET; Wed 0030 GMT; Tue 1930 EST)
Consensus Forecast, Y/Y: 2.3%
Consensus Range, Y/Y: 2.0% to 2.8%
Consumer prices are seen rising at a 2.3 percent rate in October from a year ago versus 2.1 percent in September.
New Zealand RBNZ Announcement (Wed 1400 NZDT; Wed 0100 GMT; Tue 2000 EST)
Consensus Forecast, Change: -50 bp
Consensus Range, Change: -75 bp to -25bp
Consensus Forecast, Level: 4.25%
Consensus Range, Level: 4.0% to 4.50%
Forecasters expect the RBNZ to cut the official cash rate by 50 basis points to 4.25 percent. The RBNZ has cut rates by a total of 75 basis points at the last two meetings as inflation has dropped into the 1-3 percent target range and the economy has slowed sharply.
Germany GfK Consumer Climate for December (Wed 1000 CET; Wed 0900 GMT; Wed 0400 EST)
Consensus Forecast, Index: -18.3
Consensus Range, Index: -19.0 to -18.0
Consumer sentiment has been recovering but forecasters expect the December Gfk reading at minus 18.3, flat from minus 18.3 in November and well down from minus 21.0 in October.
US Durable Goods Orders for October (Wed 0830 EST; Wed 1330 GMT)
Consensus Forecast, New Orders - M/M: 0.5%
Consensus Range, New Order - M/M: -0.5% to 2.6%
Consensus Forecast, Ex-Transportation - M/M: 0.2%
Consensus Range, Ex-Transportation - M/M: -0.8% to 0.4%
Durable goods orders, everyone’s favorite volatile data series, is expected to show an increase of 0.5 percent on the month in October with an increase of 0.2 percent ex-transportation orders.
US GDP for Third Quarter (Wed 0830 EST; Wed 1330 GMT)
Consensus Forecast, Q/Q - Annual Rate: 2.8%
Consensus Range, Q/Q - Annual Rate: 2.8% to 2.9%
Consensus Forecast, Personal Consumption Expenditures - Annual Rate: 3.7%
Consensus Range, Personal Consumption Expenditures - Annual Rate: 3.7% to 3.7%
On the second reading for the third quarter, no revision is expected, with GDP growth at a 2.8 percent rate versus 2.8 percent in the advance report. PCE spending is expected up at a 3.7 percent rate versus 3.7 percent initially reported.
US International Trade in Goods (Advance) for October (Wed 0830 EST; Wed 1330 GMT)
Consensus Forecast, Balance: -$104.5 B
Consensus Range, Balance: -$107.3 B to -$99.3 B
The consensus for goods trade looks for a deficit of $104.5 billion in October, down from a wider than expected $109.0 billion in September.
US Jobless Claims (Wed 0830 EST; Wed 1330 GMT)
Consensus Forecast, Initial Claims - Level: 217K
Consensus Range, Initial Claims - Level: 195K to 220K
The call is 217,000 as forecasters look for claims to move back toward their four-week moving average of 218,000 from a surprisingly low 213,000 last week. Economists have been off on this one lately as they have underestimated the resilience of the employment market.
US Wholesale Inventories (Advance) for October (Wed 0830 EST; Wed 1330 GMT)
Consensus Forecast, M/M: 0.0%
Consensus Range, M/M: 0.0% to 0.0%
No change on the month is the call for wholesale inventories in the advance report.
US Personal Income and Outlays for October (Wed 1000 EST; Wed 1500 GMT)
Consensus Forecast, Personal Income - M/M: 0.3%
Consensus Range, Personal Income - M/M: 0.1% to 0.4%
Consensus Forecast, Personal Consumption Expenditures - M/M: 0.4%
Consensus Range, Personal Consumption Expenditures - M/M: 0.2% to 0.5%
Consensus Forecast, PCE Price Index - M/M: 0.2%
Consensus Range, PCE Price Index - M/M: 0.2% to 0.2%
Consensus Forecast, PCE Price Index - Y/Y: 2.3%
Consensus Range, PCE Price Index - Y/Y: 2.2% to 2.3%
Consensus Forecast, Core PCE Price Index - M/M: 0.3%
Consensus Range, Core PCE Price Index - M/M: 0.3% to 0.3%
Consensus Forecast, Core PCE Price Index - Y/Y: 2.8%
Consensus Range, Core PCE Price Index - Y/Y: 2.7% to 2.8%
Income is seen up 0.3 percent and outlays up 0.4 percent in the latest month, in line with their recent trend. The PCE price index is seen up 0.2 percent on the month and up 2.3 percent from a year ago. Core PCE is seen up 0.3 percent on the month and up 2.8 percent on the year. The persistence of monthly core PCE increases like this is giving investors concern that the hoped-for Fed rate cut won’t materialize in December.
US Pending Home Sales Index for October (Wed 1000 EST; Wed 1500 GMT)
Consensus Forecast, M/M: -1.8%
Consensus Range, M/M: -2.1% to 0.4%
Forecasters expect pending home sales down 1.8 percent on the month in October after a big 7.4 percent rise in September. Mortgage rates were down in September and back up in October.
Australia Capital Expenditures for Third Quarter (Thu 1130 AET; Thu 0030 GMT; Wed 1930 EST)
Consensus Forecast, Q/Q: 1.0%
Consensus Range, Q/Q: -0.6% to 3.5%
Capex is seen up 1.0 percent on the quarter after dropping 2.2 percent in the previous quarter.
South Korea Bank of Korea Announcement (Thu 1000 KST; Thu 0100 GMT; Wed 2000 EST)
Consensus Forecast, Change: 0 bp
Consensus Range, Change: 0 bp to 0 bp
Consensus Forecast, Level: 3.25%
Consensus Range, Level: 3.25% to 3.25%
After kicking off its rate cutting cycle with a 25 basis point cut to 3.25 percent in October, forecasters look for the BOK to keep rates steady this week.
Eurozone M3 Money Supply for October (Thu 1000 CET; Thu 0900 GMT; Thu 0400 EST)
Consensus Forecast, Y/Y-3-Month Moving Average: 3.35%
Consensus Range, Y/Y-3-Month Moving Average: 3.3% to 3.4%
Forecasters see the annual growth rate of M3 flat at 3.35 percent in October.
Eurozone EC Economic Sentiment for November (Thu 1100 CET; Thu 1000 GMT; Thu 0500 EST)
Consensus Forecast, Economic Sentiment: 95.6
Consensus Range, Economic Sentiment: 95.4 to 95.6
Consensus Forecast, Industry Sentiment: -13.5
Consensus Range, Industry Sentiment: -14.0 to -12.8
Forecasters expect economic sentiment flat at 95.6 in November from October. Industry sentiment is expected to go down to minus 13.5 from minus 13.0 in October.
Germany CPI for November (Thu 1400 CEST; Thu 1300 GMT; Thu 0800 EST)
Consensus Forecast, M/M: 0.2%
Consensus Range, M/M: -0.2% to 0.4%
Consensus Forecast, Y/Y: 2.3%
Consensus Range, Y/Y: 2.2% to 2.4%
German headline inflation is seen up 0.2 percent on the month and up 2.3 percent on the year in the initial November reading.
South Korea Industrial Production for October (Fri 0800 KST; Thu 2300 GMT; Thu 1800 EST)
Consensus Forecast, M/M: -0.7%
Consensus Range, M/M: -0.7% to -0.6%
Forecasters look for a decline of 0.7 percent on the month.
Germany Retail Sales for October (Fri 0800 CEST; Fri 0700 GMT; Fri 0200 EST)
Consensus Forecast, M/M: -0.5%
Consensus Range, M/M: -0.5% to -0.5%
Consumers remain under pressure and retail sales are expected to be down 0.5 percent on the month.
Germany Unemployment Rate for November (Fri 0955 CET; Fri 0855 GMT; Fri 0355 EST)
Consensus Forecast, Rate: 6.2%
Consensus Range, Rate: 6.1% to 6.2%
Forecasters see no relief in Germany’s unemployment picture. The jobless rate is expected to rise to 6.2 percent in November from 6.1 percent in October. Germany barely avoided recession over the summer but forecasters are gloomy about the fall.
Eurozone HICP Flash for November (Fri 1100 CET; Fri 1000 GMT; Fri 0500 EST)
Consensus Forecast, HICP - Y/Y: 2.3%
Consensus Range, HICP - Y/Y: 2.2% to 2.4%
Consensus Forecast, Narrow Core - Y/Y: 2.8%
Consensus Range, Narrow Core - Y/Y: 2.8% to 3.0%
Base effects are expected to lift Eurozone headline inflation with HICP up 2.3 percent and narrow core up 2.8 percent in the latest month versus 2.0 percent and 2.7 percent a month ago.
Canada Monthly GDP for September (Fri 0830 EST; Fri 1330 GMT)
Consensus Forecast, M/M: 0.2%
Consensus Range, M/M: 0.1% to 0.3%
Forecasters see GDP up 0.2 percent on the month, below the 0.3 percent advance estimate from Statistics Canada.
Canada GDP for September (Fri 0830 EST; Fri 1330 GMT)
Consensus Forecast, Annual Rate: 1.0%
Consensus Range, Annual Rate: 0.8% to 1.3%
Estimates look for GDP up an annualized 1.0 percent in the third quarter, well below the 1.5 percent the Bank of Canada predicted and way down from 2.1 percent in the second quarter. This leaves the Bank of Canada on track for another 50 bp rate cut in December.
US Chicago PMI for November (Fri 0945 EST; Fri 1445 GMT)
Consensus Forecast, Index: 44.2
Consensus Range, Index: 43.0 to 47.5
Forecasters look for the ever-volatile Chicago report to rebound to 44.2 in November after its October plunge to 41.6.
China CFLP PMI for November (Fri 0930 CST; Fri 0130 GMT; Thu 2030 EST)
Consensus Forecast, Manufacturing Index: 50.4
Consensus Range, Manufacturing Index: 50.4 to 50.6
The manufacturing PMI is expected to tick up to 50.4 from 50.1 a month earlier.
|

